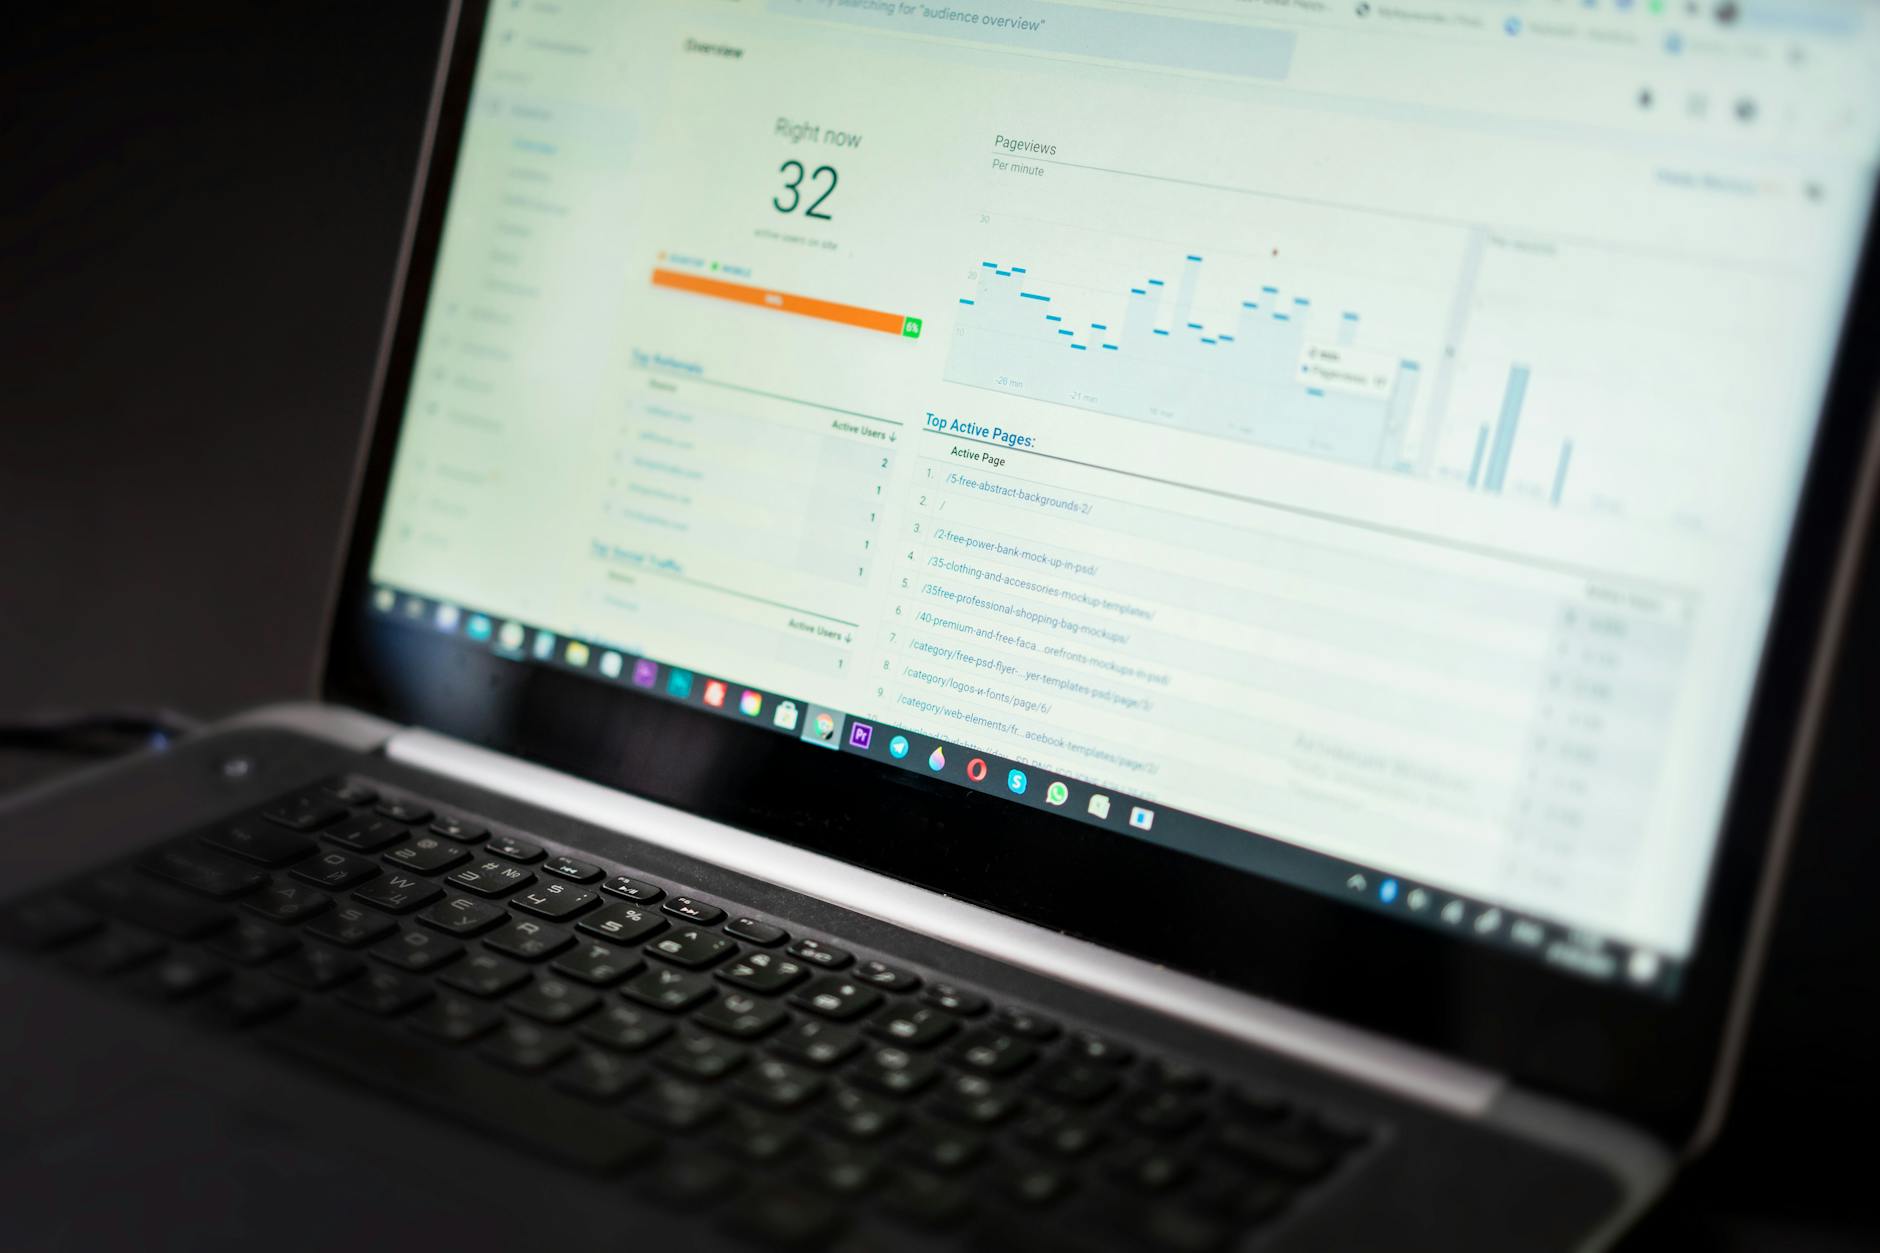
DMOs sit on more data than most realise — website analytics, social media metrics, email performance, visitor survey results, accommodation occupancy figures, event attendance, trade partner data, and economic impact estimates. The problem isn't data availability; it's data usability.
Most DMO teams drown in spreadsheets and platform-specific dashboards, each showing a fragment of the picture. A social media manager can tell you engagement rates. The web team knows traffic sources. The trade manager has agent training completion data. But nobody has a unified view connecting marketing activity to visitor outcomes.
A well-designed DMO analytics dashboard transforms fragmented data into actionable insight — answering the questions that matter: "Is our marketing working? Where should we invest more? What should we stop?"
The DMO Data Landscape
Available Data Sources
| Data Source | What It Tells You | Access Method |
|---|---|---|
| Google Analytics | Website traffic, user behaviour, content performance, conversion | Direct (owned) |
| Social media analytics | Reach, engagement, audience demographics, content performance | Platform dashboards (Meta, TikTok, etc.) |
| Email platform | Open rates, click rates, subscriber growth, campaign performance | ESP dashboard (Mailchimp, etc.) |
| Training platform | Agent training completion, knowledge scores, engagement | AI platform analytics |
| Accommodation data | Occupancy rates, ADR, booking patterns | Partner reporting, STR data |
| Visitor surveys | Satisfaction, spending, duration, activities, information sources | Survey platform |
| Event data | Attendance, ticket sales, visitor origin | Event organisers |
| Economic impact | Visitor spending, employment, GVA contribution | Modelling, ONS data |
| PR/media | Coverage volume, reach, sentiment, equivalent advertising value | Media monitoring tools |
| Paid media | Impressions, clicks, conversions, cost per acquisition | Ad platform dashboards |
The Integration Challenge
Each source has its own format, update frequency, and access method. The dashboard must normalise these into a coherent view. This typically requires:
- API integrations for digital data (Google Analytics, social, email, ad platforms)
- Manual data input for partner-reported data (accommodation, events)
- Periodic uploads for survey and economic data
- Automated reporting from the training platform
Building the DMO Dashboard
Dashboard Level 1: Executive Summary
Audience: DMO leadership, board, stakeholders Update frequency: Monthly Purpose: "Is our marketing working?"
| Metric | What It Shows | Data Source |
|---|---|---|
| Estimated visitor numbers (month) | Are we attracting more visitors? | Accommodation data + modelling |
| Year-on-year visitor change | Are we growing? | Historical comparison |
| Estimated visitor spending | What's the economic contribution? | Survey data × visitor numbers |
| Website sessions (month) | Is digital awareness growing? | Google Analytics |
| Social media reach | How many people are we reaching? | Social analytics (aggregated) |
| Trade partners trained | Are we building selling capacity? | AI platform |
| Campaign ROI (active campaigns) | Are campaigns cost-effective? | Attribution modelling |
| Seasonality distribution | Are we extending beyond peak? | Monthly visitor distribution |
Visualisation: Dashboard with KPI cards, trend lines, and year-on-year comparisons. One page that stakeholders can absorb in 60 seconds.
Dashboard Level 2: Marketing Performance
Audience: Marketing team Update frequency: Weekly Purpose: "What's working and what isn't?"
Channel performance comparison:
| Channel | Traffic/Reach | Engagement | Conversion | Cost | ROI |
|---|---|---|---|---|---|
| Organic search | Sessions | Pages/session, time on site | Enquiries | Content production cost | Visits ÷ cost |
| Paid search | Impressions, clicks | CTR, quality score | Bookings attributed | Ad spend | Revenue ÷ spend |
| Paid social | Reach, impressions | Engagement rate | Website visits, enquiries | Ad spend | Visits ÷ spend |
| Organic social | Reach | Engagement rate | Website referrals | Staff time | Visits ÷ time cost |
| Delivered | Open rate, click rate | Website visits, bookings | Platform + staff time | Revenue ÷ cost | |
| PR | Coverage, AVE | Sentiment | Traffic spikes post-coverage | PR team cost | Estimated impact ÷ cost |
| Trade | Agents trained | Completion rate | Agent bookings | Platform + content cost | Bookings ÷ cost |
Content performance:
- Top 10 pages by traffic (which destination content is attracting visitors?)
- Content engagement metrics (which content keeps visitors reading?)
- Content conversion (which pages lead to enquiry or booking actions?)
- Underperforming content (what needs refreshing or replacing?)
Campaign tracking:
- Active campaign performance vs. objectives
- Creative performance (which ads, posts, and emails are performing best?)
- Audience performance (which segments are responding?)
- Budget pacing (are we on track with spend vs. plan?)
Dashboard Level 3: Trade and Partnership
Audience: Trade/partnership team Update frequency: Monthly Purpose: "How effective is our trade engagement?"
| Metric | What It Shows | Source |
|---|---|---|
| Total agents registered | Scale of trade network | Platform data |
| Training completion rate | Agent engagement | AI analytics |
| Assessment pass rate | Agent knowledge quality | AI analytics |
| Specialist certifications issued | Expert advocates created | Programme tracking |
| Agent booking volume (trained vs. untrained) | Training → revenue connection | Partner reporting |
| FAM trip ROI | Return on FAM investment | Post-FAM booking tracking |
| Trade content downloads | Agent use of selling tools | Platform analytics |
Dashboard Level 4: Visitor Intelligence
Audience: Strategy and product development Update frequency: Quarterly Purpose: "Who are our visitors and what do they want?"
| Insight | Data Source | Strategic Value |
|---|---|---|
| Visitor origin (geographic) | Surveys, website analytics | Market prioritisation |
| Visitor demographics | Surveys, social data | Segment targeting |
| Length of stay | Accommodation data, surveys | Product development, value assessment |
| Activities undertaken | Surveys | Experience development priorities |
| Spending patterns | Surveys | Economic impact, revenue optimisation |
| Satisfaction scores | Surveys | Quality assurance, issue identification |
| Information sources | Surveys | Channel investment prioritisation |
| Likelihood to recommend | NPS from surveys | Brand health monitoring |
| Repeat visit intention | Surveys | Loyalty programme development |
Using Dashboards to Make Decisions
Decision 1: Budget Reallocation
Data signal: Paid social campaigns generating website visits at £0.45 per visit; organic search content generating visits at £0.08 per visit.
Decision: Shift 15% of paid social budget to content production, focusing on SEO-optimised destination guides that compound over time.
Decision 2: Market Prioritisation
Data signal: German market showing 35% traffic growth year-on-year with 4.2 minutes average time on site; French market flat with 1.8 minutes average.
Decision: Increase German market investment (content, paid media, trade training in German). Reduce French market spend until product-market fit improves.
Decision 3: Trade Investment
Data signal: Trained agents booking 45% more trips than untrained agents. Current training reach: 800 agents. Addressable market: 5,000+ agents.
Decision: Scale AI training programme to reach 2,500 agents within 12 months. Expected impact: 600+ additional bookings.
Decision 4: Seasonality Strategy
Data signal: Off-season content receiving high engagement but low conversion. Visitor surveys show interest but lack of bookable products.
Decision: Invest in off-season product development with accommodation and experience partners before scaling off-season marketing.
Stakeholder Reporting
The Monthly Report
Translate dashboard data into a concise stakeholder report:
Structure:
- Headline KPIs (one page): visitor numbers, spending, marketing ROI
- Campaign highlights (one page): what's working, what we've learned
- Channel performance (one page): comparative performance by channel
- Trade engagement (half page): agent training progress, trade bookings
- Next month priorities (half page): planned activities and expected outcomes
Golden rule: Lead with outcomes (visitors, spending, economic impact), not activities (posts published, emails sent). Stakeholders care about results, not effort.
Annual Report
A comprehensive review connecting marketing investment to destination performance:
- Year-on-year visitor and spending trends
- Marketing channel ROI analysis
- Campaign performance review
- Trade channel contribution analysis
- Seasonality progress
- Strategic recommendations for the following year
This report justifies budgets, demonstrates accountability, and informs strategic direction.
Track your destination performance with TravAI →
This article is part of our DMO Marketing series. Related reading: