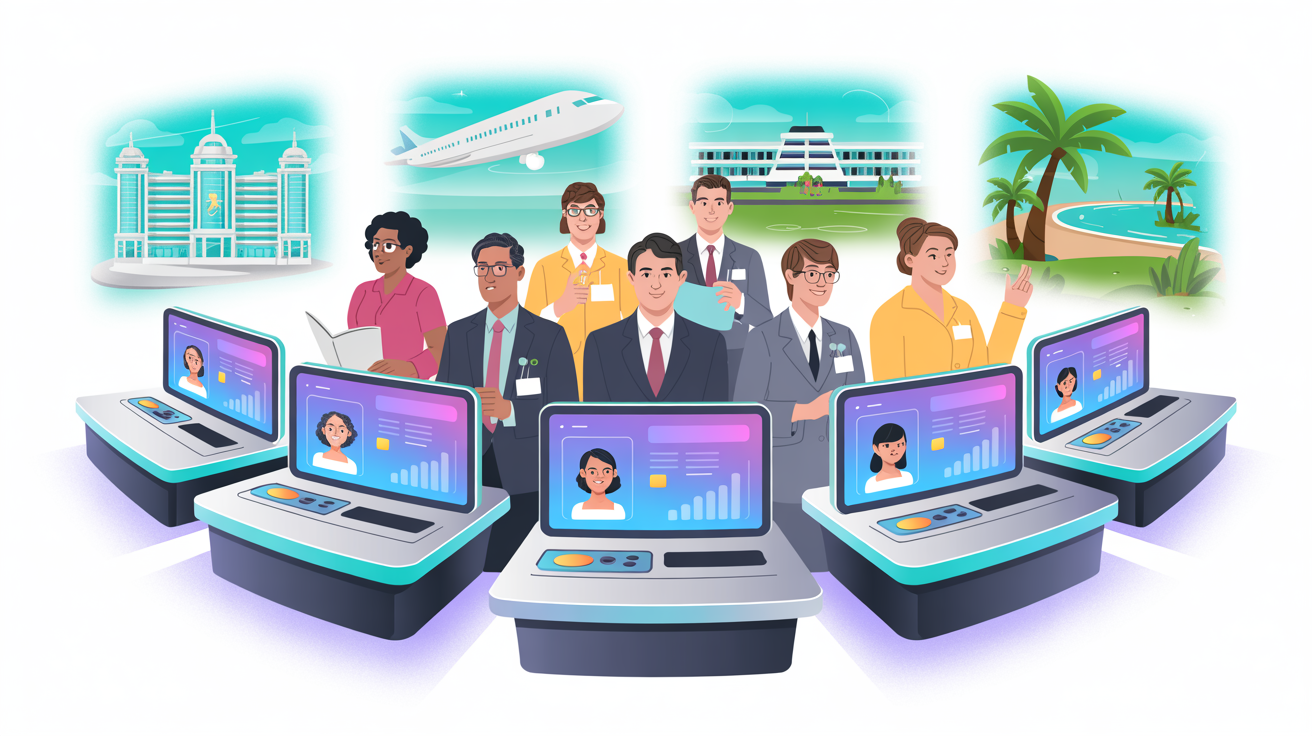
Airlines create enormous volumes of trade content — product guides, route announcements, fare updates, cabin specifications, loyalty programme details. Yet agent engagement with this content is consistently low: typical open rates of 12-18% on emails, 5-10% completion on training modules, and PDF download-to-read rates estimated at under 15%. The problem is not agent laziness — it's content that doesn't match how agents work, learn, or sell.
Why Most Airline Content Fails
The Disconnect
| What Airlines Create | What Agents Need |
|---|---|
| 40-page product guide (PDF) | 5-minute summary they can absorb between calls |
| Feature-focused descriptions ("Seat width: 21 inches") | Experience-focused language ("A seat wide enough to relax properly") |
| Annual content updates | Real-time updates when products, routes, or fares change |
| English-only (or 2-3 languages) | Content in their own language |
| Information to read | Skills to practise |
| Product knowledge | Selling techniques and scripts |
| One format for all | Content matched to their experience level |
Source: TTG Trade Content Survey; Phocuswright Agent Engagement Study
Engagement Benchmarks
| Content Type | Typical Engagement | Industry Best Practice |
|---|---|---|
| PDF product guide | 8-15% download; estimated 15% read | 30%+ with interactive alternative |
| Trade email newsletter | 12-18% open rate | 25-35% open rate |
| Webinar | 3-5% of invited attend | 12-18% attendance |
| Video (3+ minutes) | 25% start; 40% watch to end | 60%+ with short-form interactive |
| AI-powered module | 35-55% completion | 60%+ with incentive structure |
| AI roleplay | 40-60% of those who start | 65%+ with coaching feedback |
Content That Works
Format Comparison
| Format | Engagement | Knowledge Retention | Selling Impact | Cost Efficiency |
|---|---|---|---|---|
| PDF brochure | Low | Low (5-10% at 30 days) | Minimal | Low cost, low return |
| Video | Medium | Medium (15-20% at 30 days) | Low | Medium cost, medium return |
| Interactive module | High | High (40-60% at 30 days) | Medium | Medium cost, high return |
| AI-powered module | High | Very high (60-75% at 30 days) | High | Low cost, very high return |
| AI roleplay | Very high | Very high (70-85% at 30 days) | Very high | Low cost, very high return |
| AI coaching | Very high | Very high | Very high | Low cost, very high return |
The Content Pyramid
Structure content in layers so agents engage at the level that suits them:
| Layer | Content | Duration | Purpose |
|---|---|---|---|
| 1. Quick Reference | One-page selling card — key facts, selling points, scripts | 2 min read | Immediate use during customer conversations |
| 2. Core Knowledge | Interactive module — product knowledge with assessment | 8-15 min | Foundation understanding |
| 3. Selling Skills | Roleplay scenarios — practise selling the product | 10-15 min | Conversation confidence |
| 4. Deep Dive | Detailed product guide — specifications, comparisons, expert knowledge | 20-30 min | Specialist depth (optional) |
Most agents engage with layers 1-2. Top performers progress to layers 3-4. The key is that layer 1 alone provides enough information to sell.
Content Creation with AI
Speed and Cost
| Content Element | Traditional (Agency) | AI-Powered | Saving |
|---|---|---|---|
| Product module | 3-4 weeks; £5,000-£8,000 | 2-3 days; £500-£1,000 (review + refinement) | 85-90% |
| Selling scripts | 1-2 weeks; £2,000-£3,000 | 1 day; included | 90%+ |
| Assessment questions | 1 week; £1,500-£2,500 | Hours; included | 95% |
| Roleplay scenarios | 2-3 weeks workshop; £3,000-£5,000 | 1-2 days; included | 90% |
| Multi-language versions | 4-6 weeks per language; £3,000-£5,000 each | Days; included in platform | 95%+ |
| Content update | 2-3 weeks; £1,500-£3,000 | 1-2 days; minimal cost | 90% |
For airlines operating across 12+ markets with frequent product changes, AI content creation transforms the economics of trade enablement.
Content Templates
Template 1: Cabin Product Module
| Section | Content | Duration |
|---|---|---|
| The experience | What the customer sees, feels, and enjoys — photo/video-led | 2 min |
| Key features | Top 5 differentiators vs economy and vs competitors | 2 min |
| The customer | Who this cabin suits — 3 customer profiles | 2 min |
| The sell | 2 scripts for different customer types | 2 min |
| Quick quiz | 5 questions testing key selling knowledge | 2 min |
| Total | 10 min |
Template 2: Route Launch Module
| Section | Content | Duration |
|---|---|---|
| The route | Origin, destination, frequency, aircraft, times | 1 min |
| The destination | Top 5 reasons to visit; best time to go | 3 min |
| The customer | 3 ideal customer profiles for this route | 2 min |
| The competition | How this route compares to alternatives | 2 min |
| The sell | 2 selling scripts for different enquiry types | 2 min |
| Quick quiz | 5 questions | 2 min |
| Total | 12 min |
Detailed route launch training guide →
Template 3: Ancillary Product Card
| Section | Content | Duration |
|---|---|---|
| The product | What it is, what's included, price range | 1 min |
| Best customers | Who benefits most | 1 min |
| The script | How to introduce it naturally | 1 min |
| Common objection | One objection with response | 1 min |
| Total | 4 min |
Distribution Strategy
Multi-Channel Approach
| Channel | Content Type | Frequency | Purpose |
|---|---|---|---|
| AI training platform | Modules, assessments, roleplay | Ongoing (always available) | Core knowledge and skills |
| New content alerts, highlights | Weekly or bi-weekly | Drive platform visits | |
| BDM visits | Live demonstrations, coaching | Monthly | Personal reinforcement |
| Trade portal | Quick-reference cards, links | Always available | On-demand support |
| Social media | Tips, facts, quick sells | 3-5 times per week | Awareness and engagement |
| Trade press | Features, case studies | Monthly | Credibility and reach |
Timing Content for Impact
| Content Trigger | Response Time | Content |
|---|---|---|
| Route launch | Training live 8 weeks before launch | Full route module + selling scripts |
| New aircraft/cabin delivery | Content ready at delivery date | Cabin module + comparison with previous product |
| Fare promotion | Content same day as promotion launch | Promotion selling card + email |
| Schedule change | Content within 1 week | Updated route information + selling implications |
| Seasonal campaign | Content 4 weeks before campaign start | Seasonal module + customer matching |
| Competitor action | Content within 1-2 weeks | Competitive positioning update |
Engagement Tactics
Driving Content Consumption
| Tactic | Implementation | Expected Impact |
|---|---|---|
| Micro-learning | 5-8 minute modules, not 30-minute marathons | 2-3x completion rate |
| Mobile-first | Content optimised for smartphone completion | 40%+ of completions on mobile |
| Gamification | Points, badges, leaderboards | 25% increase in engagement |
| Social proof | "2,400 agents completed this module this month" | 15% increase in starts |
| BDM advocacy | BDMs demonstrate content during visits | Strongest conversion driver |
| Certification | Structured programme with commercial incentives | 3-5x engagement vs unstructured |
| Fresh content | Monthly new modules or updates | Repeat visits; reduced churn |
| Personalisation | Content relevant to agent's market and experience | Higher completion and relevance |
Content Refresh Cycle
| Frequency | Action | Reason |
|---|---|---|
| Weekly | New selling tip or product highlight | Keeps content fresh; gives reason to return |
| Monthly | New or updated module | Sustained engagement |
| Quarterly | Programme review and major update | Content quality assurance |
| Seasonally | Seasonal selling campaign content | Aligned to booking patterns |
| Ad hoc | Product changes, route launches, competitive response | Timely and relevant |
Measuring Content Effectiveness
Content Metrics
| Metric | Target | Measurement |
|---|---|---|
| Module completion rate | 45%+ of starters | Platform analytics |
| Average assessment score | 78%+ | Platform analytics |
| Time to complete | Within 10% of designed duration | Platform analytics |
| Return rate | 30%+ of completers return within 30 days | Platform analytics |
| Mobile completion share | 35%+ | Platform analytics |
| Content satisfaction | 4.0+/5.0 | Agent survey |
Commercial Impact Metrics
| Metric | Before | Target | Measurement |
|---|---|---|---|
| Trade channel premium share | 10-14% | 18-22% | Booking data |
| Ancillary attach rate | 22-28% | 38-48% | Ancillary reporting |
| Average booking value | £450-£520 | £580-£680 | Revenue data |
| Active agent rate | 25-30% | 40-50% | Booking data |
| Training-booking correlation | Not measured | 3-7x revenue difference by tier | Correlation analysis |
The airlines generating the highest trade channel ROI are not those with the most content — they're those whose content agents actually complete, remember, and use in customer conversations. Quality, format, and relevance matter far more than volume.
Create engaging airline training content with TravAI →
This article is part of our Airline Sales & Trade series. Related reading: