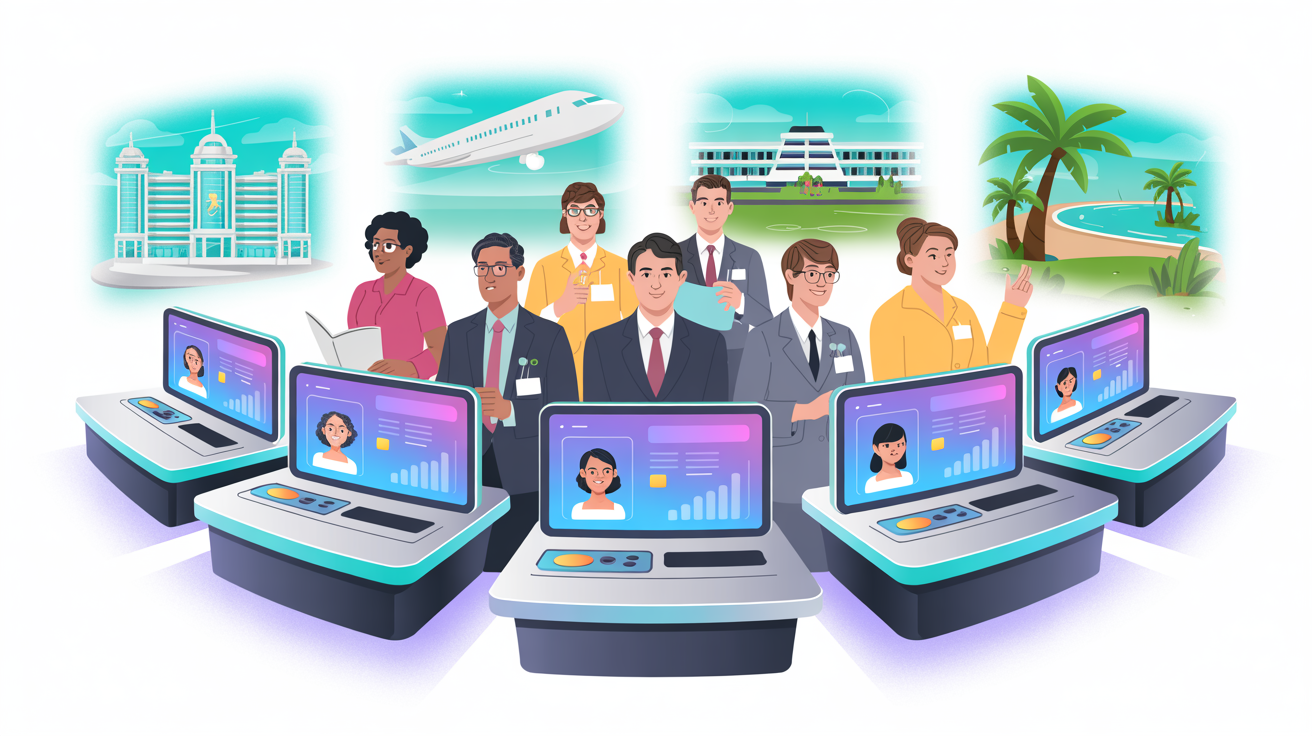
Staff turnover costs the UK travel and hospitality industry an estimated £14 billion annually. For individual businesses, each departing employee costs 1-2x their annual salary — and the cost is even higher for experienced, revenue-generating roles like travel agents and hotel sales managers.
This article presents the data behind travel industry turnover, analyses the real causes, and shows how AI-powered training and coaching is proving to be one of the most effective retention tools available.
The Turnover Data
Industry Benchmarks
| Sub-sector | Annual Turnover Rate | UK Average (All Sectors) |
|---|---|---|
| Hotels (all staff) | 38-45% | 15% |
| Restaurants and catering | 45-65% | 15% |
| Travel agencies | 22-30% | 15% |
| Tour operators | 18-25% | 15% |
| Airlines (cabin crew) | 15-22% | 15% |
| Airlines (ground staff) | 25-35% | 15% |
| Cruise (shipboard staff) | 20-30% | 15% |
| Attractions | 35-50% | 15% |
Sources: CIPD People Management Survey, ONS Labour Market Statistics, industry reports
Every travel sub-sector exceeds the UK all-industry average of approximately 15%, with hospitality sectors running 2-4x higher.
The Cost Calculation
| Cost Component | Travel Agent | Hotel Staff Member | Sales Manager |
|---|---|---|---|
| Recruitment | £2,000-£4,000 | £1,000-£2,500 | £5,000-£10,000 |
| Training and onboarding | £3,000-£6,000 | £1,500-£3,000 | £4,000-£8,000 |
| Lost productivity (ramp-up) | £5,000-£12,000 | £2,000-£5,000 | £10,000-£20,000 |
| Customer relationship loss | £3,000-£8,000 | £500-£2,000 | £5,000-£15,000 |
| Manager time (recruitment, onboarding) | £1,500-£3,000 | £800-£1,500 | £2,000-£4,000 |
| Temporary cover/overtime | £1,000-£3,000 | £500-£2,000 | £2,000-£5,000 |
| Total per departure | £15,500-£36,000 | £6,300-£16,000 | £28,000-£62,000 |
The Aggregate Impact
For a mid-size travel business (100 employees, 25% turnover):
| Metric | Value |
|---|---|
| Departures per year | 25 |
| Average replacement cost per person | £12,000-£25,000 |
| Annual turnover cost | £300,000-£625,000 |
| Revenue impact of productivity gaps | Additional £100,000-£250,000 |
| Total annual impact | £400,000-£875,000 |
Reducing turnover from 25% to 15% (a 10-percentage-point improvement) saves £160,000-£350,000 annually for this size of business.
Why People Leave: The Real Causes
What Exit Interviews Say vs What's Actually Happening
| What Leavers Say | What's Actually Driving Them |
|---|---|
| "Found a better opportunity" | Felt stagnant; no development pathway visible |
| "Better pay elsewhere" | Pay gap compounded by feeling undervalued |
| "Personal reasons" | Burnout from understaffing; work-life imbalance |
| "Different career direction" | Lost confidence in travel as a sustainable career |
| "Didn't fit the culture" | Insufficient onboarding; never felt competent |
The Data Behind the Causes
| Root Cause | % Citing as Factor | Research Source |
|---|---|---|
| Lack of development/training | 45% | LinkedIn Workplace Learning Report |
| Feeling undervalued | 38% | Gallup Employee Engagement |
| Better pay available elsewhere | 35% | CIPD |
| Poor management | 32% | Gallup |
| Work-life balance | 28% | CIPD |
| Limited career progression | 27% | |
| Burnout/stress | 22% | Mental Health Foundation |
| Poor onboarding experience | 18% | SHRM |
Key insight: The top cause — lack of development and training — is also the most addressable. AI-powered training and coaching can directly impact the factor most strongly correlated with retention.
The Critical First 90 Days
Early attrition is disproportionately expensive because recruitment costs are entirely wasted:
| Timeframe | % of Annual Leavers Departing | Primary Cause |
|---|---|---|
| First 30 days | 12-18% | Poor onboarding; overwhelm; reality vs expectation gap |
| 31-90 days | 15-22% | Insufficient training; lack of confidence; no early wins |
| 91-180 days | 18-25% | Feeling stuck; no development pathway; manager issues |
| 181-365 days | 20-28% | Compensation comparison; career frustration; external offers |
| 1+ years | 15-25% | Career ceiling; burnout; life changes |
Over a third of departures happen within the first 90 days — where structured onboarding and AI training have the greatest impact.
How AI Training Reduces Turnover
The Mechanism
AI training addresses the top turnover drivers simultaneously:
| Turnover Driver | How AI Training Addresses It |
|---|---|
| Lack of development | Always-available training with visible progression |
| Feeling undervalued | Investment in development signals value |
| Limited progression | Certification pathways create visible career ladder |
| Poor onboarding | Structured, consistent onboarding regardless of mentor availability |
| Low confidence | AI coaching and roleplay practice build competence |
| Burnout | Better-trained staff work more efficiently; less stress from incompetence |
The Evidence
| Study/Case | Intervention | Turnover Reduction |
|---|---|---|
| Hotel group case study | AI training platform implementation | -30% overall; -61% first-90-day attrition |
| LinkedIn Workplace Learning | "Companies with strong learning cultures" | 30-50% higher retention |
| Deloitte | "Organisations that invest in employee development" | 34% higher retention |
| Gallup | "Employees who feel they are growing" | 3.5x more likely to be engaged |
| ATD (Association for Talent Development) | "Companies investing $1,500+ per employee in training" | 24% higher profit margins + lower turnover |
AI vs Traditional Training for Retention
| Factor | Traditional Training | AI-Powered Training |
|---|---|---|
| Availability | Scheduled events; limited slots | Always available; self-paced |
| Personalisation | One-size-fits-all | Adaptive to each learner |
| Consistency | Varies by trainer/location | Consistent across the organisation |
| Speed | Weeks between sessions | Immediate access to new content |
| Coaching | Limited to manager capacity | AI coaching at scale for every employee |
| Measurement | Completion tracking only | Knowledge scores linked to performance |
| Cost per person | £500-£2,000/year | £100-£300/year |
| Retention impact | Moderate | Significant |
Building a Retention-Focused Training Strategy
Step 1: Fix Onboarding (Impact on First-90-Day Attrition)
| Onboarding Component | Traditional | AI-Enhanced |
|---|---|---|
| Day 1 welcome | Orientation slideshow | Interactive company introduction + immediate platform access |
| Week 1 training | Shadow a colleague (if available) | Structured AI modules + shadow time |
| Week 2 practice | Watch, then try | AI roleplay practice with feedback before live interactions |
| Week 3-4 development | Left to figure it out | AI coaching on early customer interactions |
| Day 30 check-in | Informal (if it happens) | Data-driven review of knowledge and confidence |
Step 2: Create Development Pathways (Impact on 3-12 Month Attrition)
| Level | Requirements | Recognition |
|---|---|---|
| Foundation | Complete core training modules | Certificate + foundation badge |
| Proficient | Pass knowledge assessments + roleplay competency | Enhanced responsibilities + pay increment |
| Expert | Specialist certification + performance metrics | Senior title + mentoring role |
| Leader | Leadership training + team development | Management pathway |
Visible progression reduces the "career ceiling" feeling that drives experienced staff away.
Step 3: Build Continuous Development (Impact on 1+ Year Attrition)
| Activity | Frequency | Purpose |
|---|---|---|
| Microlearning modules | Daily (5 minutes) | Maintain engagement; keep knowledge current |
| AI coaching sessions | Weekly | Continuous skills improvement |
| New product/destination training | As released | Stay current; maintain expertise |
| Specialist certification | Quarterly | Career progression milestones |
| Performance review using data | Monthly | Evidence-based development conversations |
Step 4: Measure and Optimise
| Metric | Target | Measurement |
|---|---|---|
| First-90-day attrition | Below 10% | HR data |
| Annual turnover | Below 18% | HR data |
| Training completion rate | Above 70% | Platform analytics |
| Employee satisfaction (training) | Above 4/5 | Pulse surveys |
| Manager training conversations | Monthly minimum | Manager checklist |
| Development pathway progression | 50% of team advancing each year | Platform data |
The ROI of Retention-Focused Training
For a travel business with 100 employees:
| Scenario | Annual Turnover Cost | AI Training Investment | Net Saving |
|---|---|---|---|
| Current (25% turnover) | £400,000-£625,000 | £0 | — |
| Year 1 (20% turnover, -5pp) | £320,000-£500,000 | £24,000 | £56,000-£101,000 |
| Year 2 (16% turnover, -9pp) | £256,000-£400,000 | £24,000 | £120,000-£201,000 |
| Year 3 (14% turnover, -11pp) | £224,000-£350,000 | £24,000 | £152,000-£251,000 |
The cumulative three-year saving of £328,000-£553,000 from a £72,000 total investment represents a 355-668% ROI — from retention improvement alone, before accounting for the revenue benefits of better-trained staff.
Staff turnover is not an inevitable cost of doing business in travel. It's a solvable problem — and AI-powered training and coaching is the most cost-effective solution available.
This article is part of our Travel Industry Trends series. Related reading: