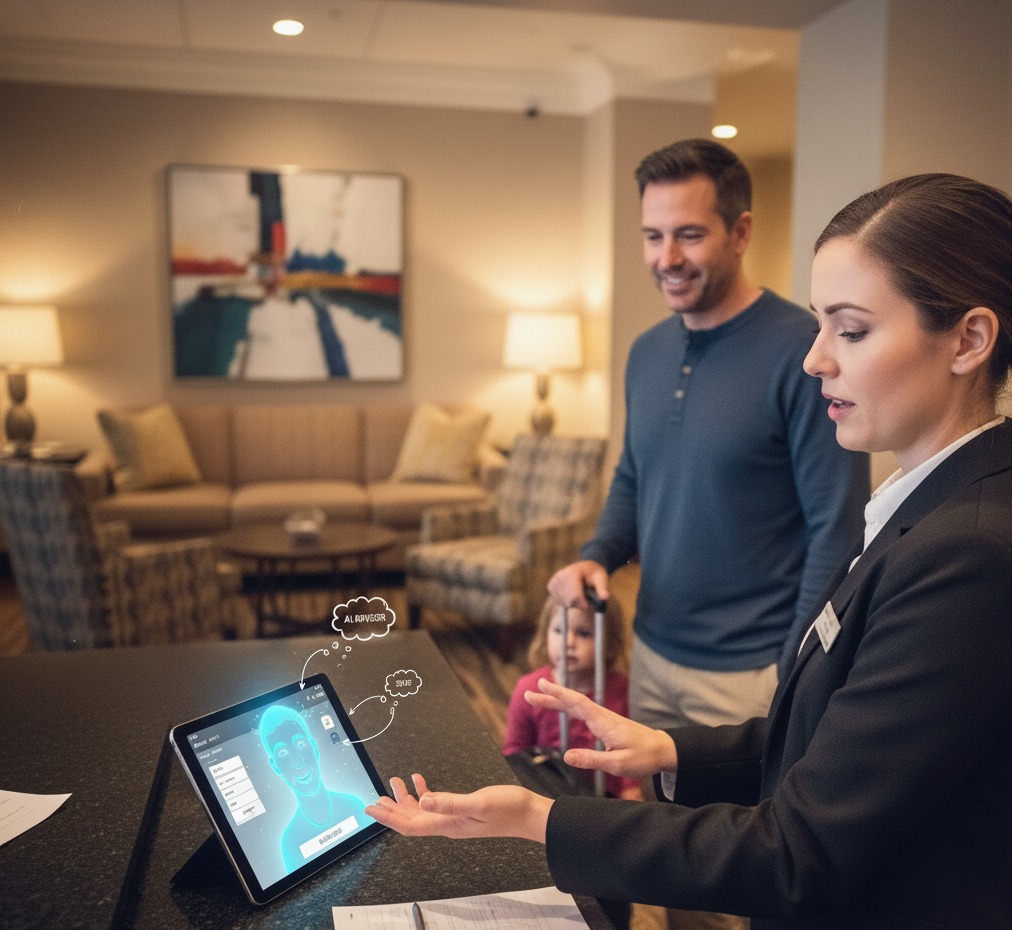
When a mid-size UK travel agency found its conversion rates stagnating despite strong enquiry volumes, the management team knew the issue was not demand -- it was sales execution. Customers were interested, but too many were leaving without booking. Traditional training methods had plateaued, and managers lacked the time to coach every agent individually.
This case study documents how the agency implemented AI-powered sales coaching through TravAI and achieved a 45% improvement in conversion rates within six months, alongside significant gains in average booking value, ancillary sales, and team confidence.
For broader context on the metrics used in this study, see our guide on How to Measure Travel Sales Performance: KPIs, Dashboards and Benchmarks.
Agency Profile
| Detail | Information |
|---|---|
| Agency type | Independent leisure travel agency, UK-based |
| Branches | 3 high street locations |
| Team size | 25 selling agents, 3 managers |
| Annual revenue | GBP 14.2 million (pre-implementation) |
| Customer base | Predominantly leisure, mix of families, couples, and groups |
| ABTA membership | Yes (ABTA member) |
| Typical booking channels | Walk-in (40%), phone (35%), email/web (25%) |
The Problem
Symptoms
The agency's managing director identified several concerning trends over the 12 months preceding the implementation.
| Metric | Agency Performance | Industry Benchmark | Gap |
|---|---|---|---|
| Enquiry-to-booking conversion | 21% | 28-32% | -7 to -11 points |
| Average booking value | GBP 2,050 | GBP 2,400-2,800 | -GBP 350 to -GBP 750 |
| Ancillary attachment rate | 38% | 55-65% | -17 to -27 points |
| Quote-to-book ratio | 26% | 35-42% | -9 to -16 points |
| Customer satisfaction (CSAT) | 82% | 88-92% | -6 to -10 points |
Source: Agency internal data; industry benchmarks from Phocuswright and TTG Media
Root Causes
The management team conducted a diagnostic review including call listening, mystery shopping, and agent self-assessments. The findings revealed consistent patterns.
| Root Cause | Evidence | Impact |
|---|---|---|
| Weak needs discovery | Agents averaged 3-4 questions before presenting options | Recommendations felt generic; customers unconvinced |
| Poor objection handling | 68% of agents folded on price objections within 30 seconds | Margins eroded; customers sensed lack of conviction |
| Inconsistent follow-up | 42% of email quotes received no follow-up within 5 days | Warm leads went cold; competitors won the booking |
| Limited upselling | Agents mentioned ancillaries in only 35% of interactions | Revenue left on the table; customer experience incomplete |
| Infrequent coaching | Managers conducted formal coaching sessions once per quarter on average | Skills developed slowly; bad habits persisted |
The underlying problem was not a lack of knowledge but a lack of practice and feedback. Agents knew the theory but could not execute consistently under pressure. According to CIPD research, this gap between knowing and doing is the most common failure point in workplace training.
The Strategy
The agency's management team developed a three-phase strategy built around AI-powered coaching and training tools.
Phase 1: Foundation (Months 1-2)
| Activity | Detail |
|---|---|
| Platform deployment | TravAI platform rolled out across all 3 branches |
| Skills assessment | Baseline competency assessments for all 25 agents |
| Priority skills identified | Closing techniques, objection handling, upselling, follow-up |
| Learning paths created | Personalised e-learning paths based on assessment results |
| Manager training | Coaching skills workshop for 3 branch managers |
Phase 2: Practice and Development (Months 2-4)
| Activity | Detail |
|---|---|
| AI roleplay sessions | Each agent completed minimum 3 roleplay scenarios per week |
| Scenario focus areas | Price objections, closing, upselling, needs discovery |
| Performance dashboards | Weekly KPI reviews using TravAI tracking tools |
| Peer learning | Top performers shared techniques in weekly 15-minute team sessions |
| Email templates | Standardised quote follow-up sequences implemented |
Phase 3: Optimisation (Months 4-6)
| Activity | Detail |
|---|---|
| Advanced scenarios | Complex multi-destination and luxury upsell roleplay |
| Individual coaching | Managers used TravAI data to deliver targeted 1:1 sessions fortnightly |
| Process refinement | Follow-up cadences adjusted based on quote-to-book data |
| Recognition programme | Monthly awards for biggest KPI improvements (not just highest numbers) |
| Consultative selling training | Shift from transactional to advisory approach |
Implementation Details
Time Investment
| Activity | Time Per Agent Per Week | Manager Time Per Week |
|---|---|---|
| E-learning modules | 30-45 minutes | 15 minutes (review completion) |
| AI roleplay practice | 45-60 minutes (3 sessions) | 20 minutes (review scores) |
| Team huddle | 15 minutes | 15 minutes (facilitate) |
| 1:1 coaching (from Month 3) | 20 minutes fortnightly | 3 hours (all agents combined) |
| Total | ~2 hours/week | ~4 hours/week |
Adoption and Engagement
| Month | Platform Adoption Rate | Avg. Roleplay Sessions/Agent/Week | Agent Satisfaction |
|---|---|---|---|
| Month 1 | 72% | 1.8 | Cautious but curious |
| Month 2 | 88% | 2.6 | Growing confidence |
| Month 3 | 94% | 3.2 | Actively requesting scenarios |
| Month 4 | 96% | 3.5 | Embedding into daily routine |
| Month 5 | 96% | 3.1 | Sustained engagement |
| Month 6 | 92% | 2.8 | Mature, self-directed use |
A key factor in adoption was making AI roleplay available on agents' own devices, allowing practice during quieter periods rather than requiring scheduled training time away from the shop floor. According to Gallup engagement research, employees who have access to regular development opportunities are 2.6 times more likely to feel engaged at work.
Results
Headline Metrics: Before vs. After
| KPI | Baseline (Month 0) | Month 3 | Month 6 | Change |
|---|---|---|---|---|
| Enquiry-to-booking conversion | 21% | 26% | 30.5% | +45% |
| Average booking value | GBP 2,050 | GBP 2,310 | GBP 2,580 | +26% |
| Ancillary attachment rate | 38% | 49% | 58% | +53% |
| Quote-to-book ratio | 26% | 33% | 38% | +46% |
| Customer satisfaction (CSAT) | 82% | 86% | 91% | +11% |
| Average response time | 6.2 hours | 3.8 hours | 2.1 hours | -66% |
| Revenue per agent (monthly) | GBP 47,300 | GBP 54,100 | GBP 61,800 | +31% |
Revenue Impact
| Revenue Component | Annual (Before) | Annual (Projected After) | Difference |
|---|---|---|---|
| Core booking revenue | GBP 14,200,000 | GBP 18,540,000 | +GBP 4,340,000 |
| Ancillary revenue | GBP 1,420,000 | GBP 2,180,000 | +GBP 760,000 |
| Total revenue | GBP 15,620,000 | GBP 20,720,000 | +GBP 5,100,000 |
Agent-Level Variation
Performance improvement was not uniform across the team. The data revealed distinct patterns.
| Agent Segment | Number | Avg. Conversion Improvement | Key Characteristic |
|---|---|---|---|
| High improvers | 8 agents | +58% | Mid-experience agents who engaged most with roleplay |
| Steady improvers | 11 agents | +39% | Consistent practice, gradual improvement |
| Moderate improvers | 4 agents | +22% | Less practice engagement, improvement in specific areas |
| Limited improvement | 2 agents | +8% | Low engagement, subsequently moved to non-selling roles |
The strongest predictor of improvement was not starting skill level but practice frequency. Agents who completed 3+ roleplay sessions per week improved at nearly double the rate of those who completed fewer than 2.
Qualitative Outcomes
Beyond the numbers, the agency reported significant qualitative improvements.
| Area | Observation |
|---|---|
| Agent confidence | Agents reported feeling "prepared for any conversation" rather than "hoping for the best" |
| Manager time | Managers spent less time firefighting poor performance and more time on strategic coaching |
| Team culture | Competitive but supportive atmosphere; agents shared techniques and celebrated each other's wins |
| Customer feedback | Noticeable increase in comments praising personalised service and expert recommendations |
| Recruitment | The agency's reputation as a training-focused employer attracted stronger candidates |
Cost-Benefit Analysis
| Cost Element | Annual Investment |
|---|---|
| TravAI platform licence | GBP 18,000 |
| Manager time (estimated opportunity cost) | GBP 12,000 |
| Agent practice time (estimated opportunity cost) | GBP 24,000 |
| Total investment | GBP 54,000 |
| Return Element | Annual Value |
|---|---|
| Additional revenue from conversion improvement | GBP 4,340,000 |
| Additional ancillary revenue | GBP 760,000 |
| Reduced recruitment costs (lower turnover) | GBP 35,000 |
| Total return | GBP 5,135,000 |
| ROI | 9,409% |
|---|
Even if only 20% of the revenue improvement is attributed directly to the training intervention (with the remainder attributed to market conditions and other factors), the ROI remains above 1,800%.
For a broader look at training costs and returns, see our analysis of AI Sales Coaching vs. Traditional Training Methods and how to reduce training costs without compromising quality.
Lessons Learned
The agency's management team identified five critical success factors.
| Lesson | Detail |
|---|---|
| Start with data | Baseline measurement was essential. Without knowing where they started, they could not prove improvement. |
| Practice frequency beats session length | Three 15-minute roleplay sessions outperformed one 45-minute session. Short, frequent practice built muscle memory. |
| Manager involvement matters | Branches where managers actively reviewed dashboards and discussed performance weekly improved 30% faster than the branch where the manager delegated this task. |
| Celebrate progress, not perfection | Recognising improvement (even from low baselines) motivated agents more than rewarding only top performers. |
| Make it easy | The TravAI platform's accessibility on personal devices removed the biggest barrier to practice: scheduling. |
What This Means for Your Agency
This case study demonstrates that the gap between average and excellent sales performance in travel is not about talent -- it is about practice, feedback, and coaching. The technology to deliver that practice at scale now exists, and the results are measurable.
Whether you manage 5 agents or 50, the principles are the same:
- Measure your current performance using structured KPIs
- Identify skill gaps through assessment
- Provide consistent, accessible practice through AI roleplay
- Track improvement through performance dashboards
- Coach with data using TravAI's sales coaching tools
Explore More
This case study is part of our Sales Skills and Coaching series. Related resources:
- How to Measure Travel Sales Performance: KPIs and Benchmarks
- AI Sales Coaching vs. Traditional Training Methods
- Building a Sales Coaching Culture in Your Travel Agency
- 10 Sales Roleplay Scenarios Every Travel Agent Should Practice
Want to see results like these in your agency? View our case studies, explore the platform, or book a consultation.